
Business analysis diagrams are visual models of how a business and its systems work: who does what, in which order, and through which software. On one outsourcing project, I used them to build a linked knowledge base with two layers, business and technical, and four levels of detail. This article shows the structure, typical examples of each diagram, and what it changed.
Last verified: October 2026
The knowledge system at a glance
The knowledge base had two layers, business and technical, and four levels of detail. Readers moved down a layer by links ("drill down") and jumped between layers by cross-links.
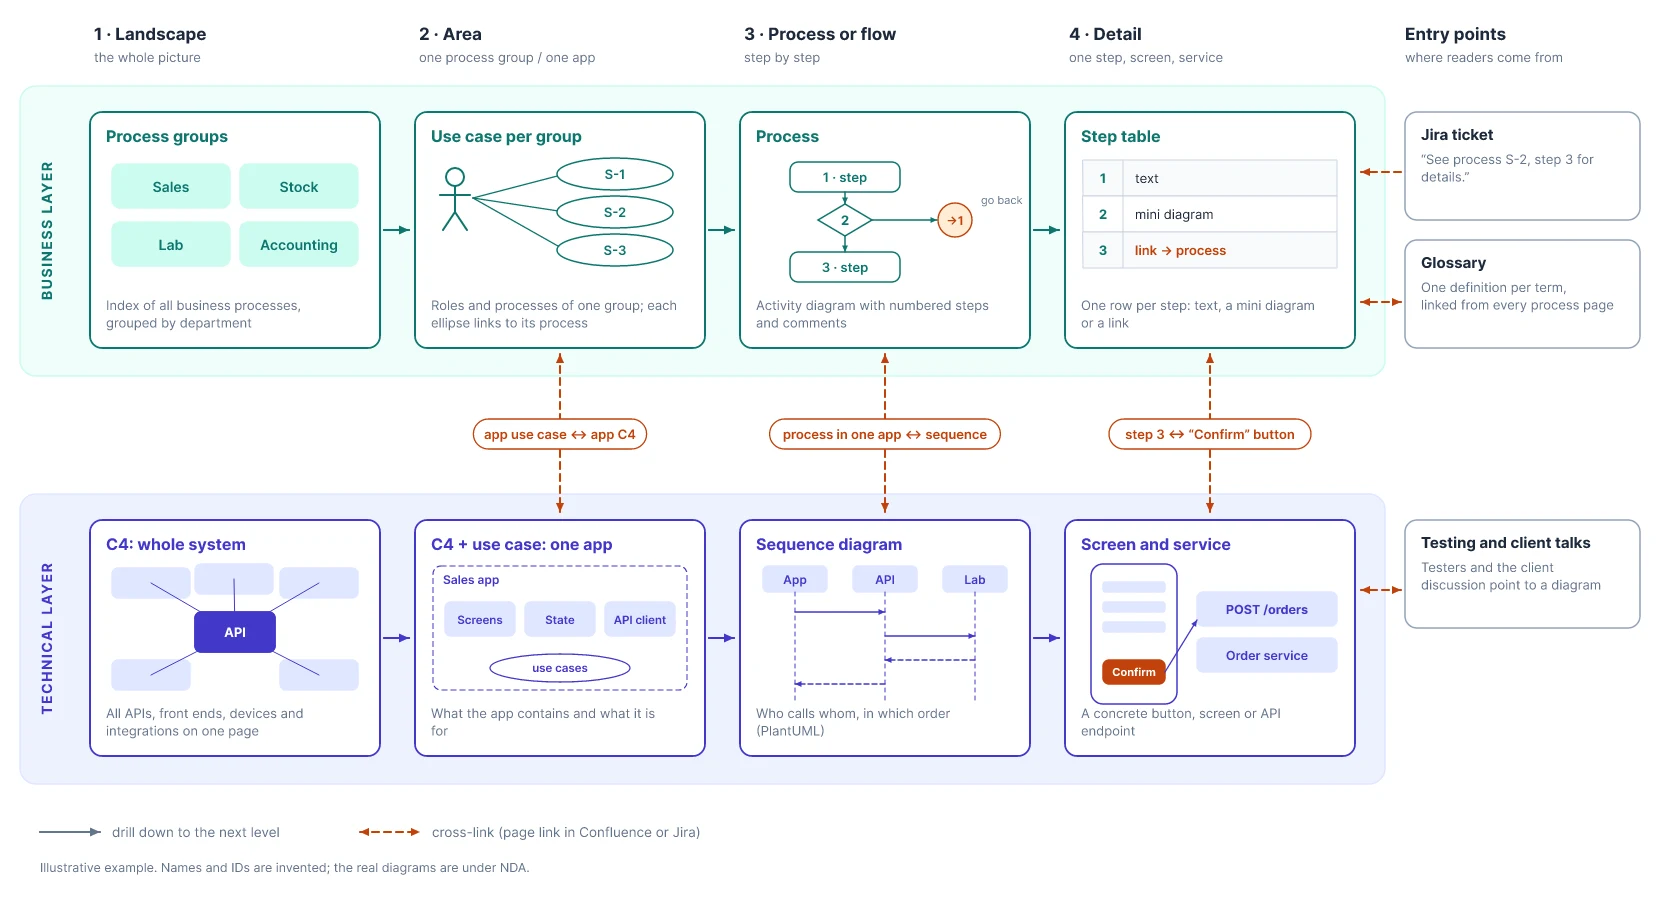
The structure of the knowledge base. Illustrative example; names and IDs are invented.
The links worked at every level:
| Link | From | To |
|---|---|---|
| Group → process | Use case diagram of a process group | The page of each process |
| Process step → button | Step 3 of a process | The "Confirm" button in the sales app |
| System → service | C4 diagram of the whole system | The C4 diagram of one app or service |
| App → purpose | C4 diagram of an app | The use case diagram of the same app |
| Process → sequence | A process that lives inside one app | Its sequence diagram |
| Ticket → step | A Jira ticket | "See process S-2, step 3" |
| Term → definition | Any process page | The glossary entry |
The rest of this article explains how this structure appeared and what each diagram did.
The project: one client, many front ends
I joined the project as a business analyst on the outsourcing side. The client is a French optical retailer with stores in France and Belgium and its own lens lab. By the time I arrived, the outsourcing partnership had already run for more than eight years. Today it has passed eleven.
The system behind the business was large. It had one main API and many front ends:
- a customer shop app and a Shopify store;
- an admin panel for all internal roles;
- a React Native app for sales staff;
- a separate React Native app for people who assemble glasses and manage stock;
- a macOS app that connects to the French and Belgian healthcare systems.
Our team had a project manager, several React Native and web front-end developers, many back-end developers, and me. On the client side we worked with product owners. Other client roles were often out of our reach. The process was close to Scrum, and there was no fixed project goal: we built what the client asked for.
The problem: knowledge lived in code and in people who left
The project had no place where knowledge was stored. When someone asked "how should this work?", the answer did not come from documentation or tickets. It came from manual testing or from reading the code. Both gave a short-lived understanding of one feature, and nobody wrote it down. The next person had to do the same work again.
For me as a newcomer, this meant there was nothing to hold on to. I could not answer two basic questions: how does this huge system work, and why does each part exist?
I tried the usual elicitation routes:
- Long calls with product owners. They often could not answer. The client had high staff turnover and no habit of passing knowledge on.
- Internal manuals. I found a few manuals for the client's employees. They described screens, not processes, and left most of my questions open.
This had a direct cost in every request. Each new client request started with "how does this work today?" Without a shared, written answer, agreement with the client was sometimes impossible. The client could ask for things that did not fit the logic of their own system. We could build them, but not cheaply, and not always in a way that solved their real problem.
How I organized the knowledge: from system map to single step
I kept requirements as text in Jira tickets. For lasting knowledge I used Confluence pages linked to Jira, and I stored that knowledge mostly as diagrams, not as text. The BABOK® Guide calls this work business analysis information management: deciding where analysis results live and how people find them.
I started drawing on my first day. I already knew how, and colleagues gave me good advice on which diagram fits which question. Over time the diagrams formed levels, each one linked to the next. In effect, this became a simple requirements architecture:
| Level | Question it answers | Diagram |
|---|---|---|
| Whole system | What exists and how big is it? | C4 diagram of all APIs, front ends, third-party devices and integrations |
| One application | What is inside this app, and what can it do for the business? | C4 diagram of the app; use case diagram |
| Process group | Which roles take part in accounting, stock or sales? | Use case diagram per process group, with links to each process |
| One process | What happens, step by step? | Activity diagram (flowchart) or sequence diagram |
| One step | What exactly happens here? | Table with text, a smaller diagram, or a link |
A reader could start at the top and "dive" down. From the system map you could open the C4 diagram of one application. For the main API, the link led to the architecture diagram of the whole back end.
A glossary (BABOK 10.23) ran across all levels. Each term had one definition, and process pages linked to it. When a diagram used a word like a status or a document type, the reader was one click away from its meaning. This kept the same term from meaning different things in different apps.
Business analysis diagrams I used and why
Most of these diagrams match techniques from chapter 10 of the BABOK® Guide, the IIBA standard of business analysis practice [5]. To see where each one sits, use our map of all 50 BABOK techniques.
C4 diagrams: the map of scale
The C4 model is a developer-friendly approach to architecture diagrams, built on a hierarchy of software systems, containers, components and code [1]. It is not part of the BABOK® Guide, but it played the role of a scope model for the whole system (compare Scope Modelling, BABOK 10.41). One page showed every API, every front end and every external system or physical device. Its only job was to show scale and borders in one place.
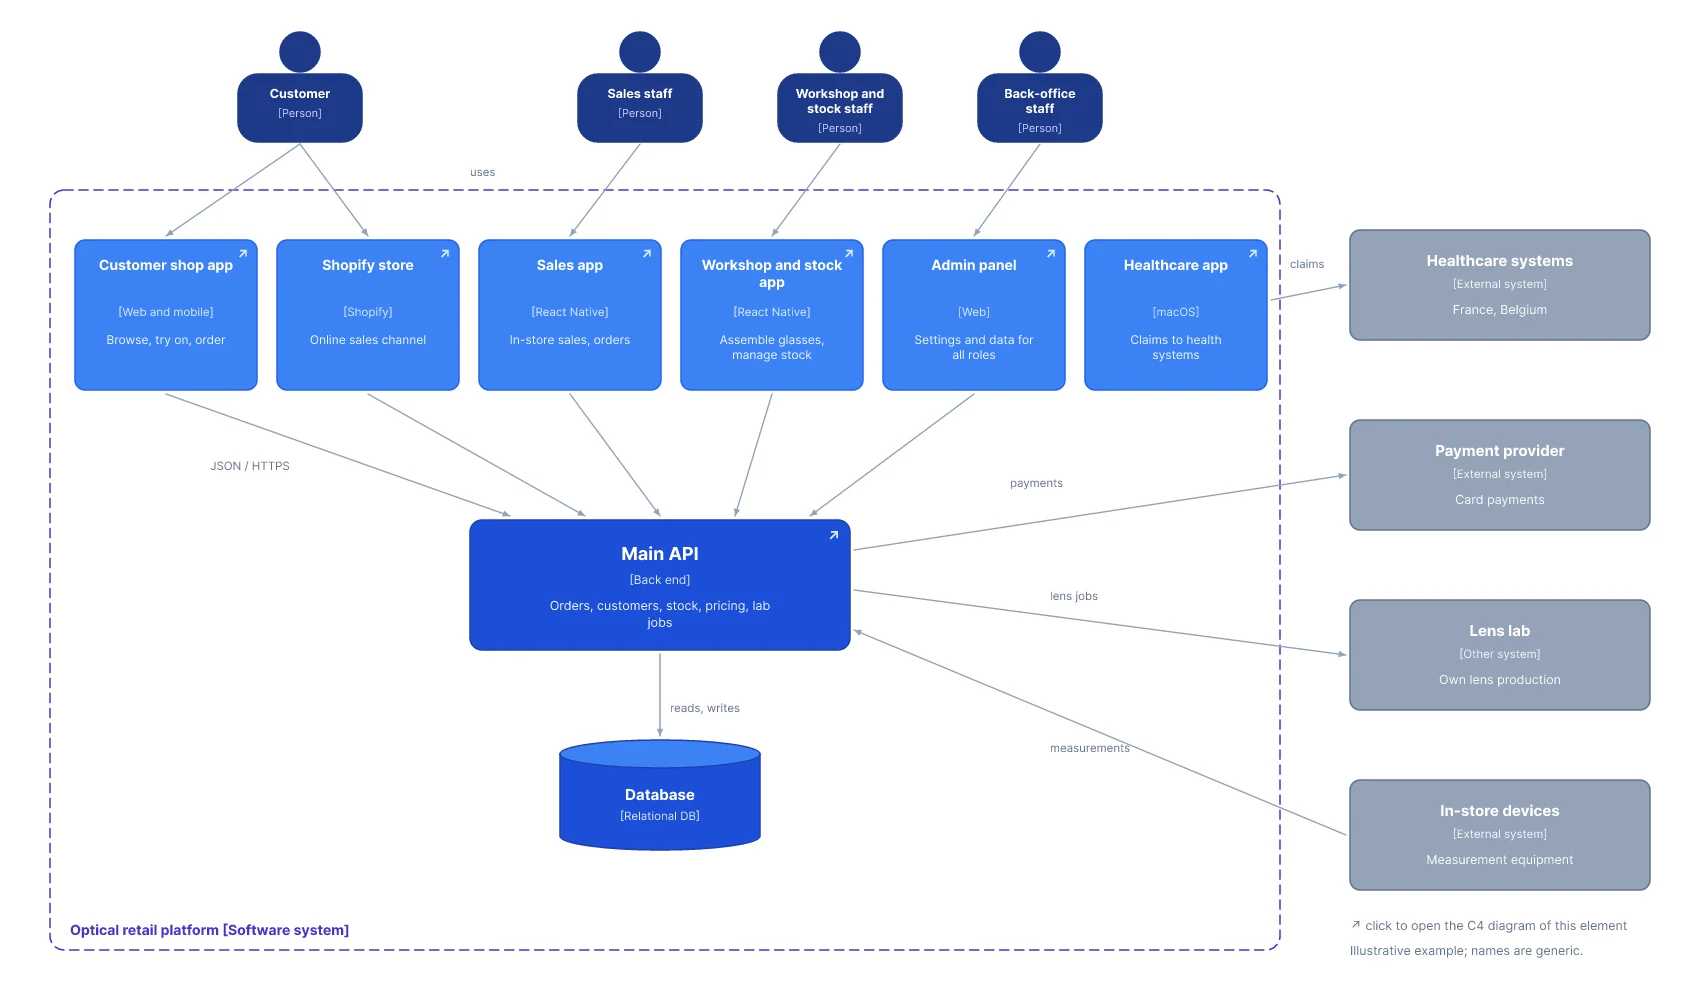
A typical C4 diagram of the whole system. Each element links to its own, more detailed C4 diagram.
Use case diagrams: what an app is for
I used use case diagrams (BABOK 10.47) in two ways:
- Per application — to show what the app can do for the client and why it exists.
- Per process group — accounting, stock, sales. Each diagram showed the roles involved and linked to a detailed description of each process.
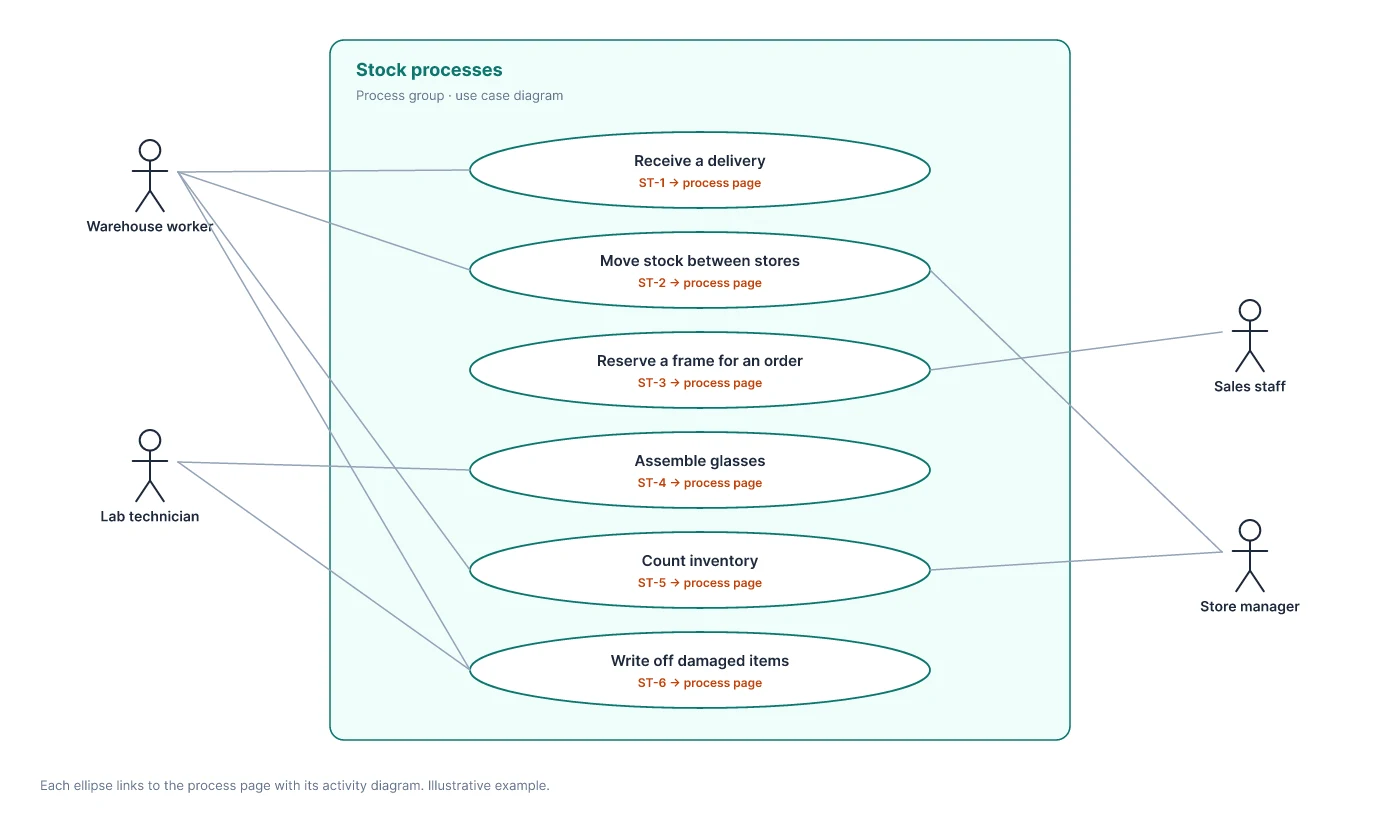
A use case diagram for one process group. Each ellipse is a link to the process page.
Activity diagrams and flowcharts: the processes themselves
This has been my favourite type since university. It is simple and gives fast understanding. I used it to describe processes (Process Modelling, BABOK 10.35).
I simplified a lot. I do not believe that everyone can read UML or BPMN without a guide. These notations have their own complex language. The Unified Modeling Language (UML) is a full graphical language for specifying and documenting systems [3]. Business Process Model and Notation (BPMN) is meant for the people who design and manage business processes [4], but its many symbols still need training. My main readers were developers who read code and had never cared about UML or BPMN, and client representatives. Neither group wanted to learn crow's foot notation or the many BPMN symbols.
So I made these choices:
- Comments instead of strict notation. For complex diagrams I sometimes added a step-by-step text copy of the whole flow.
- Numbered steps. Numbers made complex diagrams easier in two ways. First, when a decision point had a branch that returned to an earlier step, a note like "go back to step 4" was cleaner than a long arrow across the page. Second, numbers made the steps linkable from outside: a ticket could say "see Process X, step 2 for details". This gave a light form of traceability between tickets and processes.
- Freedom inside the diagram. When a process existed only inside one application, I sometimes mixed in elements from other diagram types, such as sequence-style interactions. Clarity came before purity of notation.
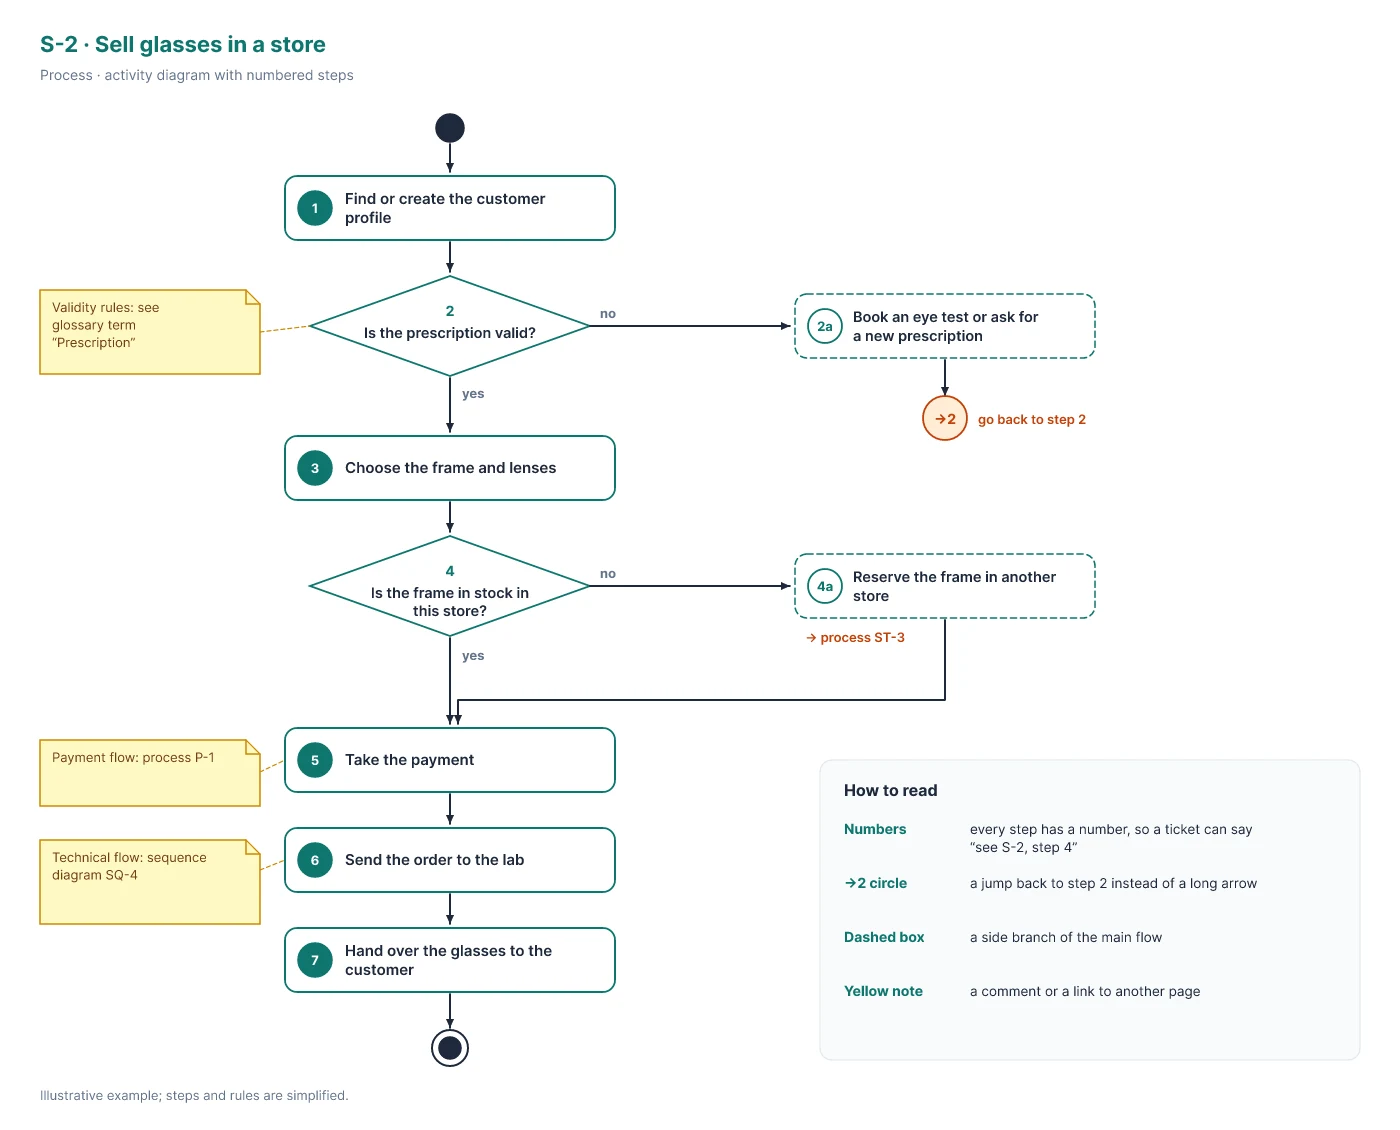
A typical process diagram: numbered steps, a "go back to step 2" connector instead of a long arrow, and comments with links.
Sequence diagrams: moving from small activity diagrams
At some point I replaced many small activity diagrams with sequence diagrams (BABOK 10.42). They show who calls whom, and in which order, better than a flowchart. I drew them in PlantUML, a tool that creates diagrams from a simple text language and supports sequence diagrams [2]. Drawing a correct sequence diagram in draw.io by hand was too hard to maintain.
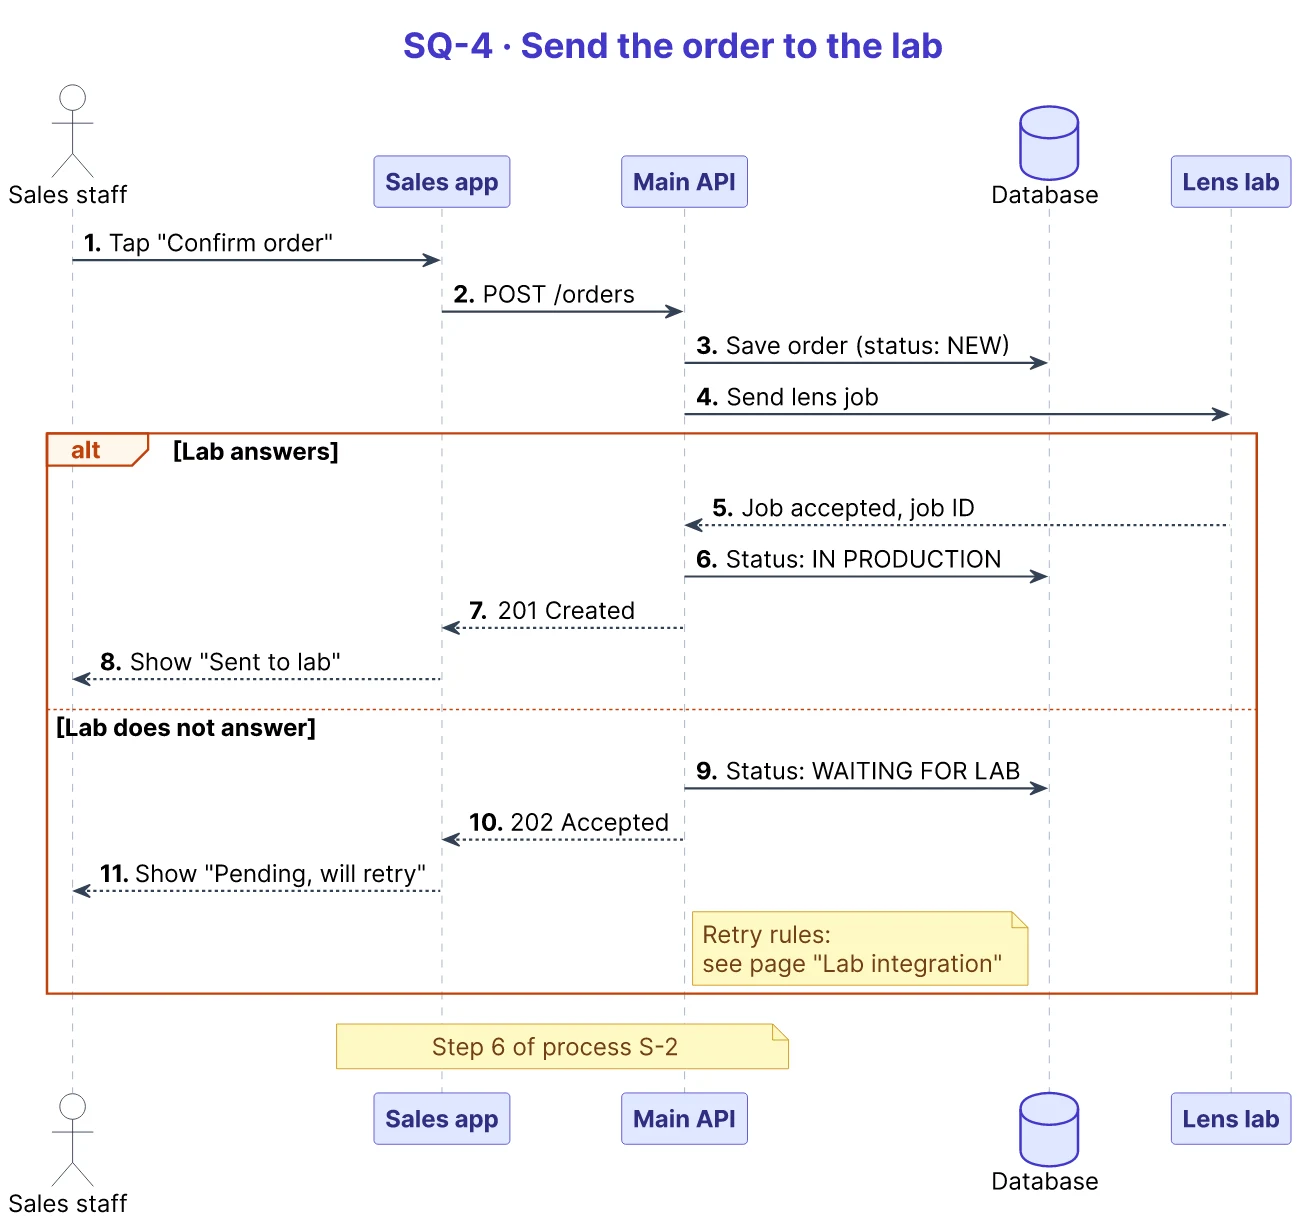
A sequence diagram drawn in PlantUML. Numbered messages and an "alt" block for the case when the lab does not answer.
Tables: text that is never just text
When a description needed text, it was never a plain block of text. A process description could be a table where each row is a step. A row could hold a sentence, a small diagram, or a link to another process page.
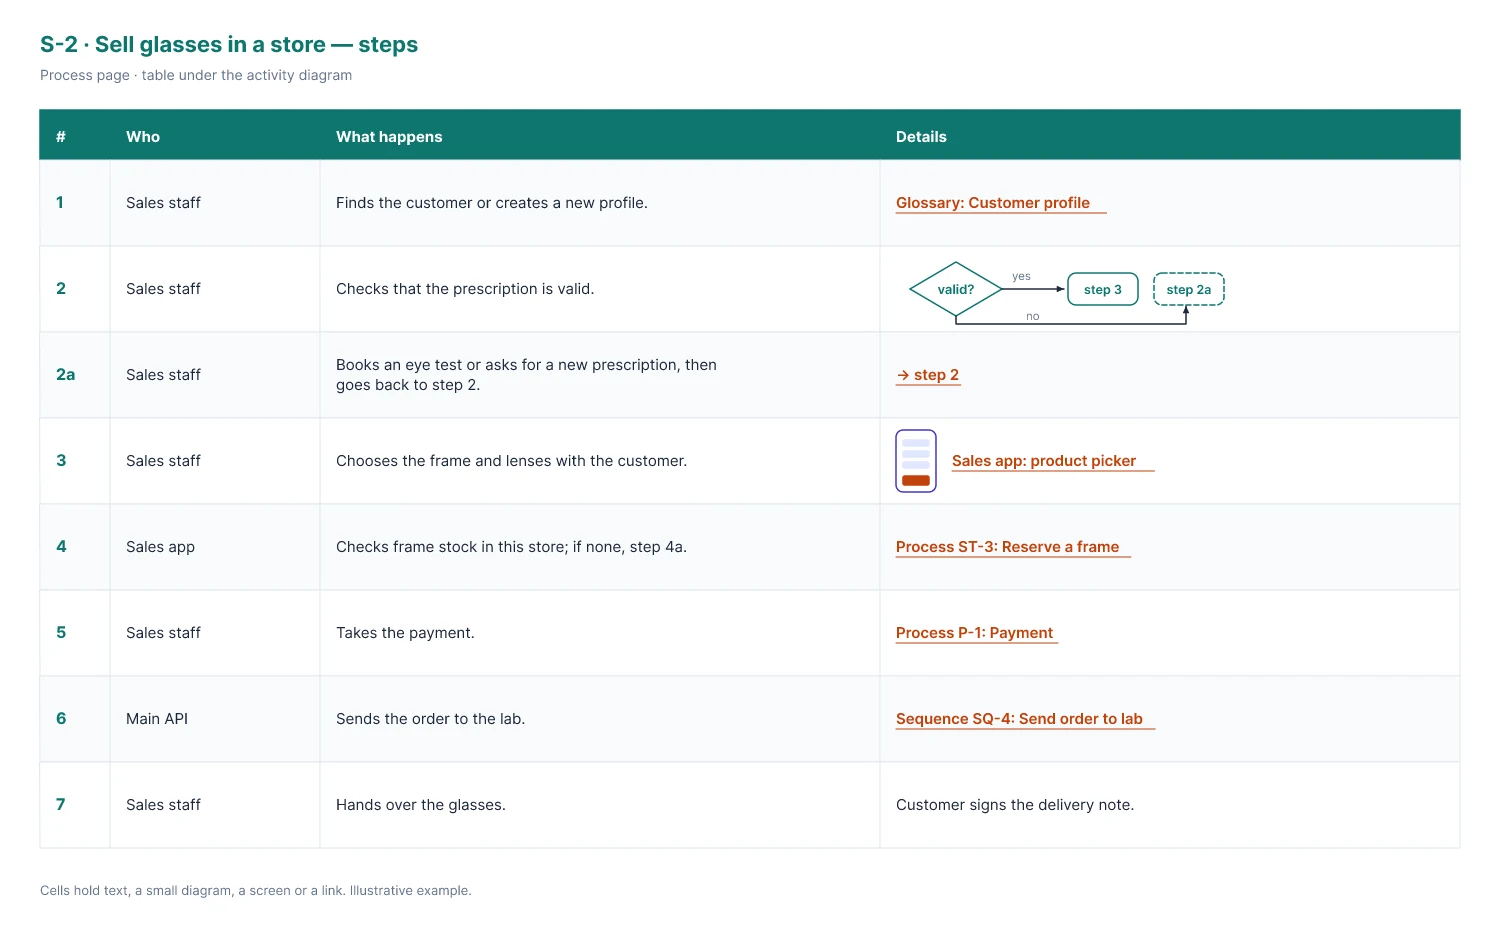
A step table under the process diagram. The "Details" column holds links, small diagrams and screens.
How I chose the type and the level of detail
My rule was simple: pick the diagram for the size of the question. The BABOK® Guide describes this choice of model types in the task Specify and Model Requirements.
- Large questions (the system, an application, a process group): C4, use case, entity relationship diagrams and other UML diagrams for structure.
- Small questions (one process, one integration): activity and sequence diagrams.
I also chose diagram types that people can read without training. The goal was to let the team look quickly, remember, and go back to work. It was not to make a perfect diagram by the rules of the notation.
For detail, my test was: can someone read this without effort? When a diagram grew too big, I did not add more boxes. I added links to related and incoming processes and kept each diagram visually light.
What changed
The diagrams became the team's main source of truth in discussions with the client and in testing.
Drawing also exposed problems that text and code reading had hidden. A diagram forces you to connect every step to the next one, and gaps become visible. On this project I found every type of problem below:
| Problem | What it can look like on a diagram (illustration) |
|---|---|
| Missing step | An arrow jumps from "order placed" straight to "glasses shipped", and nobody can say who checks the prescription in between. |
| Extra or duplicate step | The same check appears in two places, done by two roles, and neither knows about the other. |
| Dead end | A branch of a decision point has no exit: for example, what happens when a lens is out of stock is simply not drawn. |
| Unhandled integration error | The happy path to an external system is clear, but there is no arrow for "the external system did not answer". |
| Inconsistent names | One status or entity has different names in different apps, so two teams think they talk about different things. |
| Role without rights | A role appears on the use case diagram, but nobody has decided what this role may see or change. |
| Manual vs reality | The client's internal manual describes one flow, while the system behaves differently. |
Each of these is cheap to fix on paper and expensive to fix after release. Text hides them because a sentence can skip a step without looking wrong. A box with no outgoing arrow always looks wrong.
Discovering system flaws and bugs
The knowledge base also found problems in the live system, not only in plans. To draw how a process works today, I had to check the real behavior: test the feature by hand, read the code with developers, or compare apps. Each check put two versions side by side: what the business expected and what the system actually did.
When the two did not match, there were only two answers. Either the expectation was wrong, and we fixed the diagram. Or the system was wrong, and we had found a bug. We logged these bugs in Jira, linked each one to the process step where it appeared, and fixed them.
Many of these bugs had lived in the system for a long time. Nobody had noticed them, because nobody had looked at the whole flow at once. A diagram is that look.
Nobody on the team resisted. After I showed the first few diagrams, the value was clear. The client stayed quiet about them.
I have no numbers to show. I left the team two years ago, and team members still thank me for the diagrams. The other side of this story: after I left, nobody maintains them.
When not to draw
A diagram is not always the answer. Skip it when a short text does the job, or when drawing the process is harder than writing it as a few "if … then … else" sentences.
Advice for business analysts
These are lessons from my own practice, not rules from the standard.
- Do not be afraid to use diagrams. Start on day one, even if the first ones are rough.
- Expect resistance. Text is the form of knowledge most people are used to. Show value fast with a few useful diagrams instead of arguing for them.
- Write for your real readers, not for the notation. If your audience reads code, not BPMN, simplify and add comments.
- Make diagrams linkable. Number the steps and link levels to each other, so tickets and conversations can point to one exact place.
If you prepare for the CBAP exam, the techniques in this article appear in scenario questions. You can test yourself in the CBAP exam simulator.
Practice Questions
Question 1
A business analyst needs to show the order of messages between a sales app, a back-end API and an external lab system, including what happens when the lab does not answer. Which technique fits best?
A. Process Modelling B. Sequence Diagrams C. Scope Modelling D. State Modelling
Answer: B. Sequence Diagrams (BABOK 10.42) show interactions between participants in time order. Process Modelling shows the flow of activities, Scope Modelling shows borders, and State Modelling shows the states of one entity.
Question 2
Two teams use the word "order" for different things, and each team reads the requirements in its own way. What should the business analyst create first?
A. A Glossary B. A Data Flow Diagram C. A Business Model Canvas D. A Prototype
Answer: A. A Glossary (BABOK 10.23) gives each term one agreed definition. Linking process pages to it keeps the meaning the same across documents.
Question 3
A business analyst wants one diagram that shows which roles use an application and what goals they reach with it. Which technique fits best?
A. Use Cases and Scenarios B. Sequence Diagrams C. Organizational Modelling D. Decision Modelling
Answer: A. Use Cases and Scenarios (BABOK 10.47) describe how actors interact with a solution to reach goals. A use case diagram gives an overview of these actors and use cases.
FAQ
Which business analysis diagrams are most useful on a large system?
On my project, four types did most of the work: C4 diagrams for the system map, use case diagrams for each app and process group, activity diagrams for processes, and sequence diagrams for flows between apps. Tables with links held the details of each step.
Do I need to know UML or BPMN to draw useful diagrams?
No. Knowing the notation helps, but your readers matter more. Most developers and client representatives on my project did not read UML or BPMN, so I simplified the notation and added comments, numbered steps and text copies.
How do diagrams help find bugs?
To draw how a process works today, you must check the real behavior of the system. When the diagram and the system disagree, either the expectation or the system is wrong. In the second case, you have found a bug.
Which BABOK techniques cover these diagrams?
Process Modelling (10.35) covers activity diagrams, Sequence Diagrams (10.42) and Use Cases and Scenarios (10.47) cover the UML diagrams, and Glossary (10.23) covers shared terms. C4 is not a BABOK technique, but it plays a role close to Scope Modelling (10.41).
Are these techniques tested on IIBA exams?
The techniques come from the BABOK Guide, which IIBA certifications such as ECBA, CCBA and CBAP follow. The CBAP exam, for example, has 120 case-study and scenario-based questions in 210 minutes [6].
Sources
- The C4 model for visualising software architecture
- PlantUML: diagrams from plain text
- Unified Modeling Language (UML) specification, version 2.5.1
- Business Process Model and Notation (BPMN), version 2.0.2
- BABOK Guide: A Guide to the Business Analysis Body of Knowledge
- Certified Business Analysis Professional (CBAP)